Key Features
Uptime Monitoring
Easily monitor the availability of a wide range of network services: websites via HTTP/HTTPS, TCP ports, keywords in responses, JSON requests, databases, IP addresses, domain names, DNS records, Steam game servers, and more.
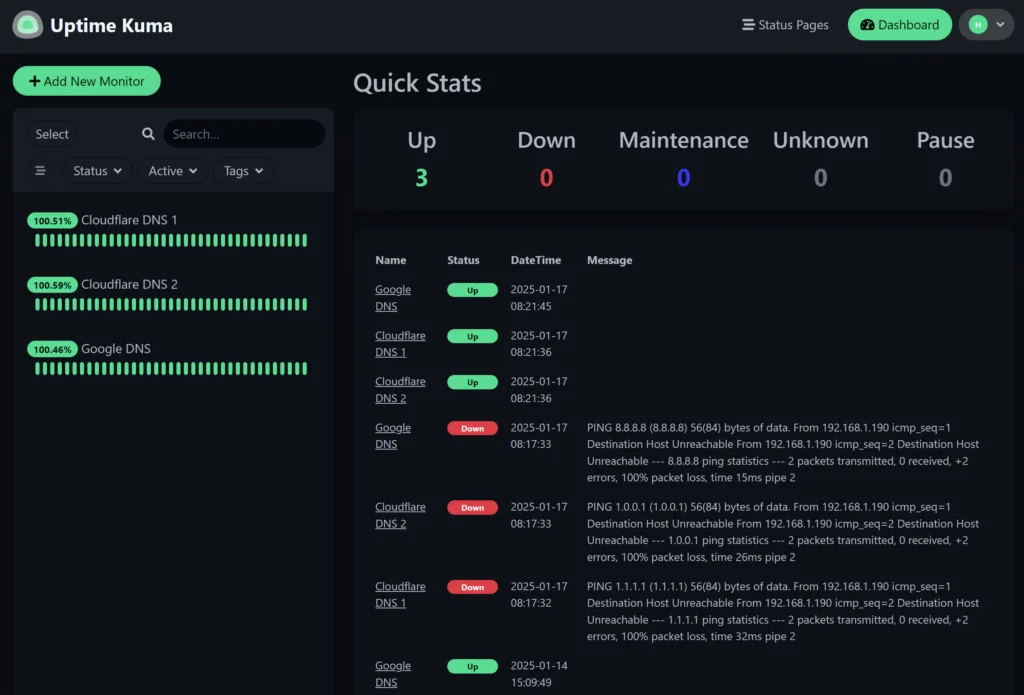
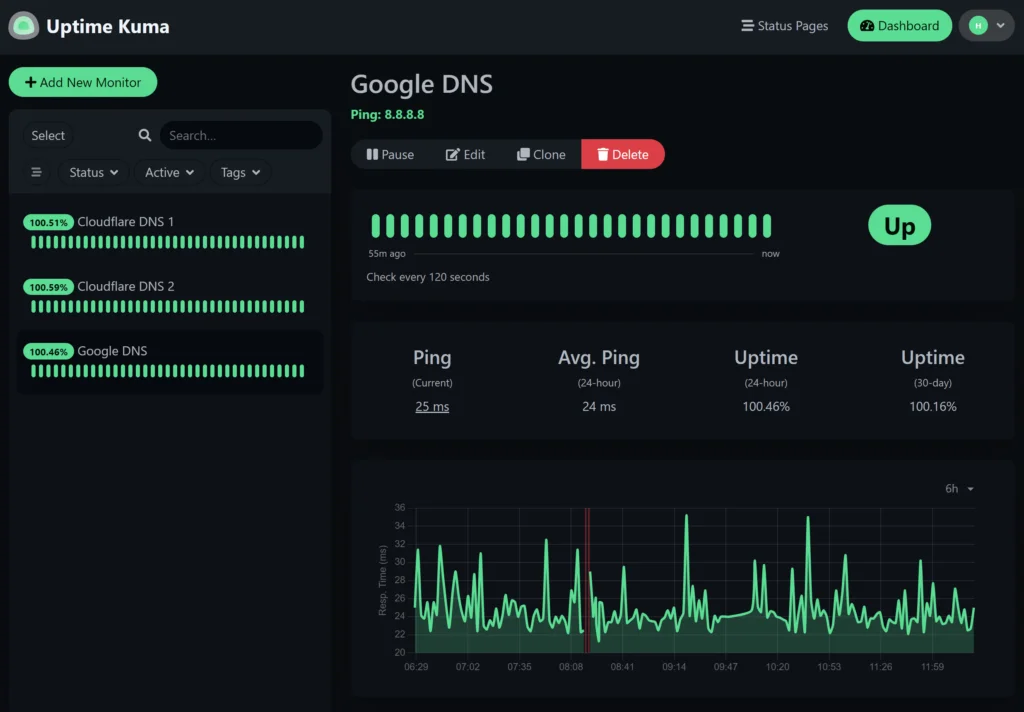
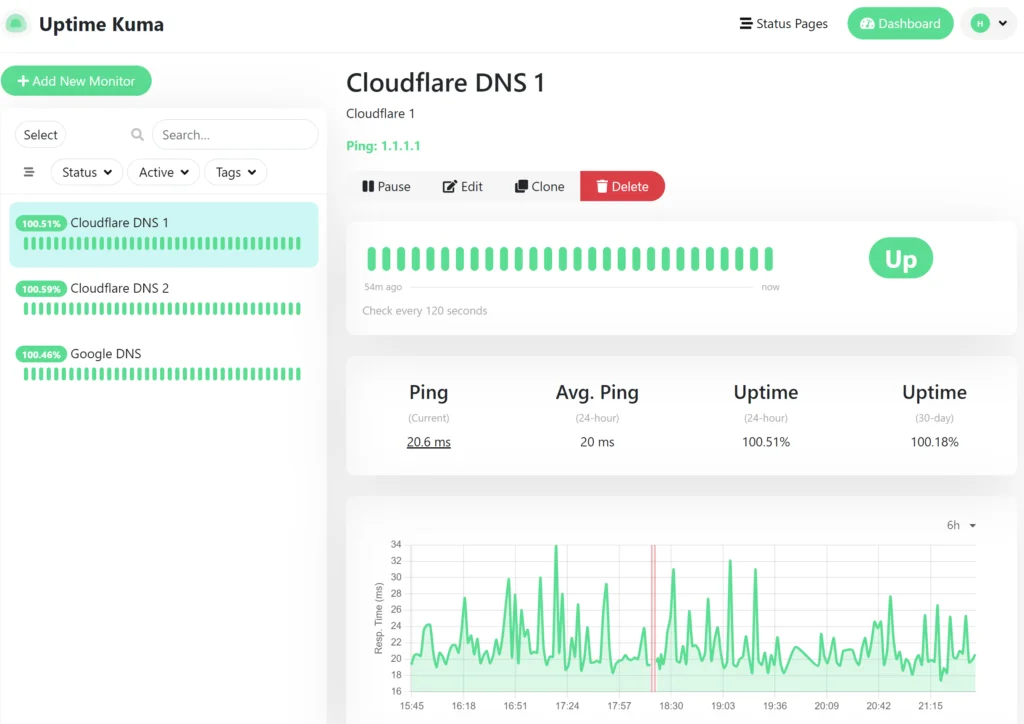
Intuitive UI
Response times and pings are displayed in smooth, interactive graphs for each monitored host. The interface is modern, clean, and responsive, designed to provide a simple and easy-to-use dashboard.
Multi-Channel Notifications
Alerts can be sent through numerous channels: SMTP email, Telegram, Signal, Slack, Discord, SendGrid, OpsGenie, PagerDuty, SMS or push notifications, and more.
Multi-Language Support
Available in over 20 languages (English, French, German, Japanese, Portuguese, etc.), with ongoing translation updates.
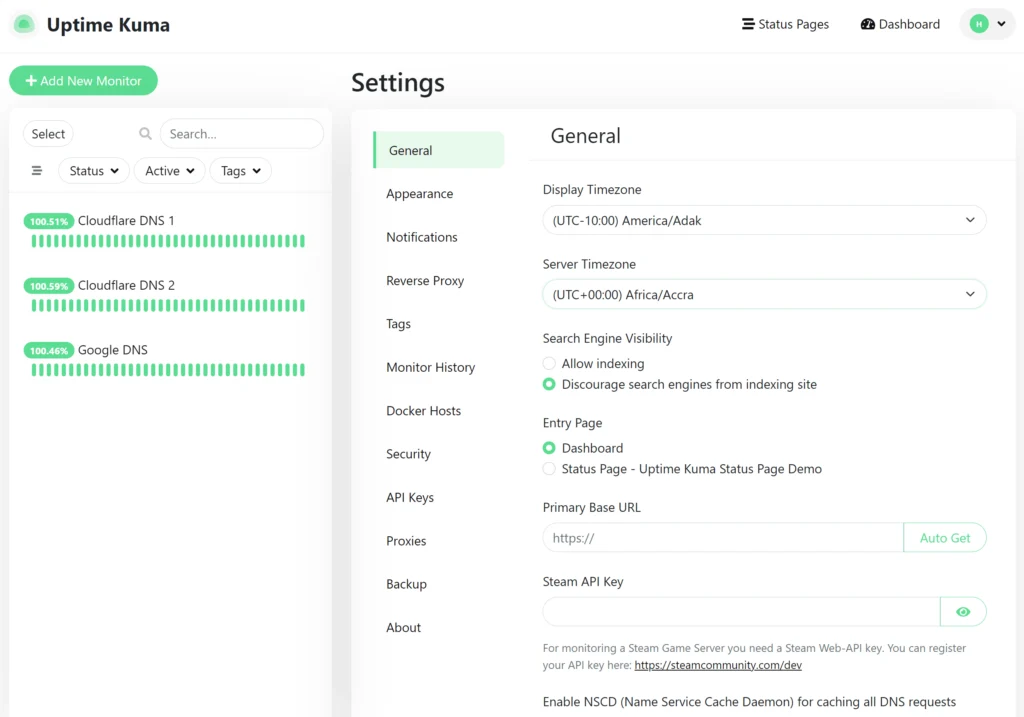
Secure Authentication
Supports two-factor authentication to strengthen access security for the admin interface.
Fast Monitoring
Checks your websites, servers, and DNS records every 30 seconds for the Enterprise plan, capable of detecting even very short outages.
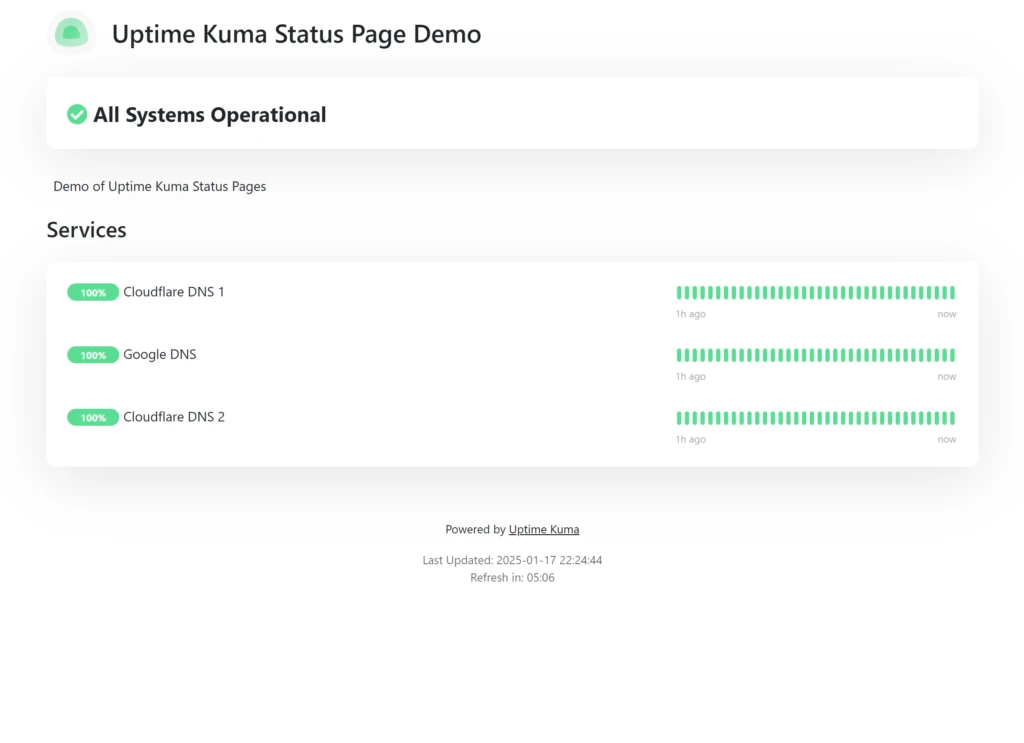
Multiple Status Pages
Create multiple public status pages to inform clients of ongoing incidents, outages, and overall service health.
Light/Dark Themes
Choose between light and dark themes, with automatic adaptation to the system’s theme.
SSL Certificates
Monitor TLS/SSL certificates: HTTPS accessibility, incorrect HTTP codes, anomalies, and upcoming expiration dates to prevent expired certificates.
API Keys
Secure access to the metrics collection endpoint (e.g., Prometheus) with dedicated API keys, in addition to or instead of basic HTTP authentication.